Showing posts with label shinyapps. Show all posts

Tuesday, 26 August 2014

TTTAR2: My First Shiny App with Bootstrap - #RUGSMAPS


Thing To Try After useR! part 2 (TTTAR2)


Originally, this post was supposed to be a sequel to TTTAR1 about h2o machine learning. Since TTTAR1 I have been carrying out more h2o tests both locally and on the cloud with the very kind support of Nick Elprin from Domino. The more I find out about h2o and Domino, the more I get addicted. So my original plan was to write a new post about combining the best of h2o and Domino - building a scalable data analytic platform on the cloud with R as the main interface.

Well something happened unexpectedly so here is a change of plan – I am going to talk about Shiny web application and data visualisation again. I will get back to h2o machine learning and Domino later. In the meantime, check out Nick’s recent blog post about Domino which is directly relevant to what I am planning to blog next.


Beautiful Shiny Apps at useR!


I know how to use Shiny and Bootstrap. Yet, before useR!, I had never felt the need to combine them. Shiny already has a clean and tidy layout by default – so why bother changing it? But then I changed my mind completely after useR!. There were quite a few beautiful Shiny apps with custom CSS on display. For example, during the second poster session, I saw this amazing Shiny app created by Christian Gonzalez and Robert Youmans.


When I had the chance to play with the app on Christian’s laptop, that sleek and professional interface just completely blew my mind. It was at this moment I realised that I was wrong and it’s time to up my game.


Revolution Analytics Data Visualisation Contest


Just like how I learned about maps in R last year, I needed to find something interesting and dive into it. After useR!, I read about this contest from Joseph’s post. It seemed like a good data visualisation exercise with a small and tabulated dataset. It was also a good opportunity to combine Shiny and rMaps (something that I hadn’t managed to do when I last worked on rCrimemap many months ago).


The Making of R User Groups Maps (RUGSMAPS)


Many thanks to the detailed Shiny examples from RStudio and Chris Beeley’s book as well as the huge rCharts/rMaps contributions by Ramnath Vaidyanathan and Kenton Russell on GitHub and Stackoverflow, I didn't need to spend much time on coding as many useful code snippets are just one Google search away.

I did, however, spend a lot more time on the layout design and user interface. Font size, colours, white spaces, choice of base map etc you name it. I also tried quite a few Bootstrap themes and finally settled with Spacelab. I am not the best person to describe the final design with correct art terminology. I just feel that this combination of blue, grey and white gives a clean layout (yet not too flashy). The RUGSMAPS app is currently hosted on ShinyApps (once again, thanks RStudio!!!)
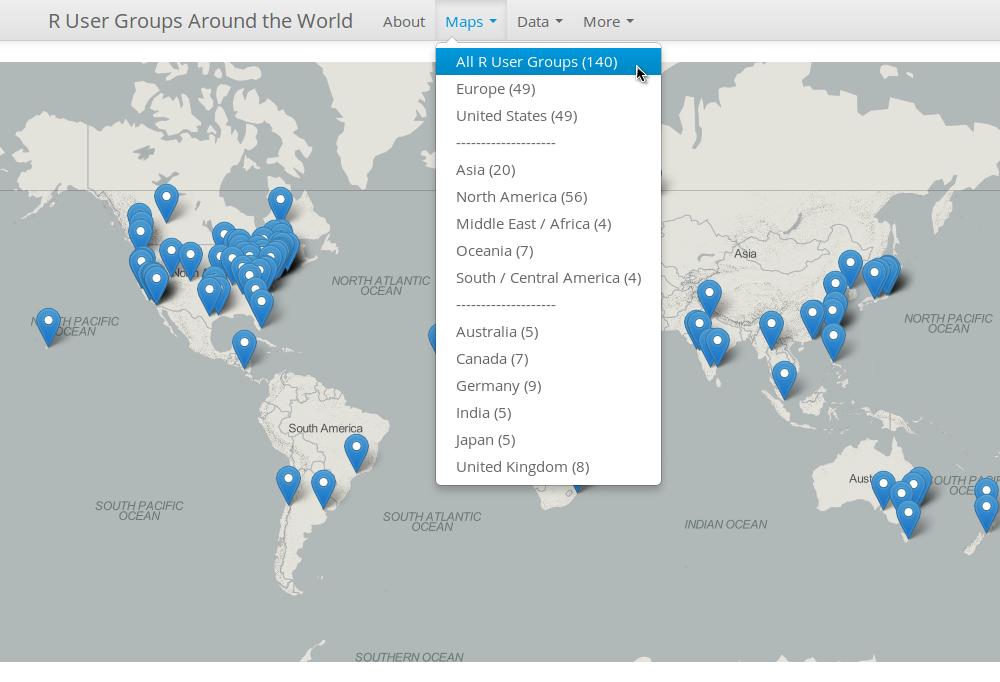
Don't agree with my colour choices? No worries, fork the repository and modify the boostrap.css in the www folder. More information can be found on the "About" page of the app so I am not going to repeat it here. Please try it out and tell me what you think about it.


What's Next?


As the RUGSMAPS app is my final submission to the contest, I am going to lock down the version so the app becomes a reference point version 1. Further improvements will be made independently (let’s just call it RUGSMAPS v2 for now). The idea is to collect more local information from the RUGs and display it accordingly on the maps. For example, in additional to the group name and city location, I can include more information such as usual meetup location, key sponsors, website, photos etc.

I have seen a cool example from Alex Bresler that shows images in the markers’ pop-up window. I am certain that we can display more information than just the group name and city location. BTW, Alex and his colleagues at Aragorn Technologies are doing some very cool interactive sports data visualisation with R for huge events (e.g. NBA, US Open) – do check them out!!!


Together We Can Make It Better! 


If you have some local information about the RUGs and are interested in improving the RUGSMAPS for the community, please drop me an email (jofai.chow@gmail.com), comment on this post or create issues on the repository. We can make this a central info hub of all RUGs! Let’s do it!!!


Acknowledgement 


First of all, I would like to thank Revolution Analytics (David and Joseph) for the award! I would also like to emphasise that the RUGSMAPS app did not just come out of my head from nowhere. It is the direct result of many cool ideas I learned and borrowed from the R community over the last year or so. To all my R friends I met on Twitter / GitHub / useR!, if you're reading this, you know I am talking about you. So thank you very much everyone!


The Rise of R in Hydroinformatics


(View from the Empire State Building Observatory - it was at this moment I realised that I should begin my career as Batman)

Just a bit off the topic, I attended the Hydroinformatics conference in New York last week and I witnessed the rise of R in this field. Although MATLAB still seems the most common programming language (ever wonder why my twitter handle sounds a bit too odd?), there were more talks about using R for Hydroinformatics this time (compared to none in the same conference two years ago). People were presenting their R packages and discussing how they use R for interfacing as well as teaching. RStudio IDE was on the big screen several times!

Yet, still no sight of Shiny but I think I can change that!!!


Wednesday, 12 March 2014

Slidify my R journey from @matlabulous to rCrimemap


My LondonR Talk

Thanks to Mango Solutions (LondonR organiser), I was given the opportunity last night to talk about my mini project ‘CrimeMap’. Instead of going through all the technical details behind the scenes, I chose to talk the audience through my R journey from a noob to a heavy user. CrimeMap was used as a case study to show how ones can benefit from learning R (or, in some ways, trying to justify the time I spent staring at RStudio IDE last year). The feedback was really great and the talk effectively expanded my network in the data science community so I am really grateful for that! You can find my presentation here.

Before the main event, there was an excellent R-Python workshop by Chris Musselle. The other two interesting presentations were "Dynamic Report Generation" by Kate Hanley and "Customer Clustering for Retail Marketing" by Jon Sedar. Their presentations will soon be made available here.

CrimeMap - A Wonderful Learning Experience

When I first started learning R for real, the goal was very simple - "let's plot something pretty with ggplot2". Well, a lot has changed since then. The more I learned, the more I discovered. It is really hard to summarise the 'R' awesomeness in a few slides due to its diversity. One thing I am absolutely certain is that I made the right move about a year ago to shift from MATLAB to R. Yet, I am keeping my twitter account name @matlabulous just to remind myself that ones should always keep an open mind for new and evolving technology (... and should avoid getting a tattoo of your potential ex-gf/bf's name. On that note, no, I don't have a tattoo.) For more information about the CrimeMap, please see my previous posts here, here and here.

Using Slidify for Professional Presentation

The talk was also the first time I presented something totally unrelated to water engineering. I thought, for a change, let’s try something different. Then I remembered looking at the Slidify slides from Jeff Leek’s Data Analysis course back in Jan-March last year. I thought that would fit perfectly for LondonR because the whole presentation would be coded completely in R. It would be a good reason to learn Slidify too. So I went through the Slidify examples, put some slides together, tweaked the CSS a little bit and then published it to GitHub – a streamline Slidify workflow well thought and designed by Ramnath Vaidyanathan. To me, the results are amazing! So amazing that I am confident to leave PowerPoint and use Slidify for professional presentations in the future.


rMaps + CrimeMap = rCrimemap

Two weeks before the presentation, I wrote an email to Ramnath as I wanted to thank him for Slidify. I told him how I enjoyed using Slidify for the LondonR slides. Out of the blue, Ramnath told me that he had seen my CrimeMap already and he kindly pointed me to this blog post about using Leaflet heat map in rMaps. I thought, OMG, why now? Then I thought, yeah, why not? So I created a new package called ‘rCrimemap’ based on Ramnath’s example and the codes from the CrimeMap project – just in time for the LondonR meeting. At first, I wanted to called the package something different but eventually I chose rCrimemap so it aligns well with Ramnath’s rCharts and rMaps.

Using ‘rCrimemap’

rCrimemap is still raw and experimental. It depends on some new packages such as dplyr, dev version of rCharts and rMaps etc. I have only developed and tested it recently on Linux. Please give it a try if you have a chance. All feedback and suggestions are welcome. Codes are here.

To install it, you will need the RStudio IDE version 0.98.501 or newer and the following packages ...

require(devtools)
install.packages(c("base64enc", "ggmap", "rjson", "dplyr"))
install_github('ramnathv/rCharts@dev')
install_github('ramnathv/rMaps')

After that, install rCrimemap package via ... 


install_github('woobe/rCrimemap')

rCrimemap is basically a big wrapper function. In fact, there is only one function 'rcmap( )' in the package at the moment. (OK, it is obviously an overkill ... but I really wanted to try developing a package.) The function is very similar to the first one I did for CrimeMap prior to the Shiny development. In terms of graphical functionality, it is not as flexible as the CrimeMap yet (for example, CrimeMap can do all these colours and facet). However, it is much more powerful than CrimeMap in the sense that users can move around, zoom in and out like using a real digital map. The colour of the heat map also changes when you zoom in/out. This gives users a much better visibility of where the local crime hot spots are when they zoom in. OK, enough said, let’s go through some example usage …

The arguments of the function 'rcmap( )' are:
  1. location: point of interest within England, Wales and Northern Ireland
  2. period: a month between Dec 2010 and Jan 2014 (in the format of yyyy-mm)
  3. type: category of crime (e.g. "All", "Anti-social behaviour")
  4. map_size: the resolution of the map in pixel (e.g. Full HD = c(1920, 1080))
  5. provider: the base map provider (e.g. "Nokia.normalDay", "MapQuestOpen.OSM")
  6. zoom: zoom level of the map (e.g. I recommend starting with 10 to show all the crimes)

Example 1: “Ball Brothers EC3R 7PP” (LondonR venue since March 2013) during the London riot (Aug 2011). The map can be viewed within RStudio IDE or be exported to a browser. The animation was created outside R (Oh ... what if rCrimemap + animation package? ... I will leave that for later.)

rcmap("Ball Brothers EC3R 7PP", "2011-08", "All", c(1000,1000),"Nokia.normalDay")


Example 2: Manchester in Jan 2014 - using "MapQuestOpen.OSM" as base map instead.

rcmap("Manchester", "2014-01", "All", c(1000,1000), "MapQuestOpen.OSM")


Credits


There you go, enjoy :)

Wednesday, 22 January 2014

CrimeMap, LondonR and a Book Review


In preparation for my LondonR talk in March, I am polishing up my CrimeMap (see previous blog post here and here) in my spare time.

Thanks to Chris Beeley and Packt, I won a free e-copy of Chris Beeley’s book following his great talk about Shiny web app during the last LondonR meeting. I find this book really useful as I am trying to implement new functionality and ideas into my CrimeMap. It illustrates very well what you can do with Shiny using lots of practical examples. So here is a quick book review for those who are also interested in developing Shiny web apps.

The book begins with a short but essential introduction to some key R functions for handling data and graphics. Chapter 2 is a walk-through of key Shiny components nicely demonstrated by an example of Google Analytics API integration. It then discusses how Shiny can be further extended with the use of HTML, CSS, JavaScript and jQuery. I find chapter 4 most useful as it goes deep into the practical aspects of handling reactivity and taking full control of inputs and outputs. The book ends with some tips on code sharing and browser compatibility.

I hope you will find this short review useful. Reviews from others can be found here, here and here. 

BTW, LondonR is great (thank you very much Mango Solutions for sponsoring it since 2009)!!! You can find the presentations from previous meetings here.

Friday, 29 November 2013

Introducing CrimeMap - A Web App Powered by ShinyApps!

A few months ago I did a mini project using open crime data and R to create crime visualisations. At that time, I was already thinking about a web app using Shiny but I couldn't justify the time to develop the app and then set up a server etc. Not until two weeks ago when I received an invitation to join the alpha testing of ShinyApps.


ShinyApps - A Wonderful Discovery

I went through the ShinyApps' getting started guide. Everything looks pretty straight forward. So I decided to go ahead and moved my codes from the crime visualisation project to a new ShinyApps project. The progress was unexpectedly smooth. Given that I had no web application development experience prior to this mini exercise, I consider this a quick success! All credit goes to the RStudio team for providing these tools and hosting services (especially Tareef Kawaf who kindly answered all my questions). I would summarise the whole process in the following few steps:
  1. Sign up for a ShingApps alpha testing account here (you will need a Google account).
  2. Install packages shiny and shinyapps (click on the links for installation help).
  3. Sign in to my.shinyapps.io, give your ShinyApps account a name ("blenditbayes" in my case) and get your application token/secret.
  4. Go through the tutorials, create the ui.R and server.R scripts for your app.
  5. Test the app locally using runApp().
  6. Once you're happy with the app, apply your token/secret and deploy your app using deployApp().
That's it! I can focus my effort solely on developing the app. The rest has been taken care of and simplified by the deployApp() and other ShinyApps functions.
 

CrimeMap in Action

So here is my first ever web app "CrimeMap" powered by ShinyApps! I will go through the usage briefly in the following sections. I hope you can give it a try and give me some feedback (e.g. what features are missing?) so I can continue to improve it. Your comments will be valuable to the ShinyApps development team too.

Basic Usage

First, enter a location of your choice (e.g. London) within England, Wales and Northern Ireland. Select the first month of crime data collection and then the length of the analysis period. After that, click on the "Update" button. My experience is that the graphs should come up within a minute if the length of analysis is less than or equal to 6 months. Depending on the location and the length of analysis, the process might take longer (say a couple minutes). The outputs (at the time of writing) are displayed in three tabs: Data, Crime Map and Trends. The Data tab shows the original crime data records downloaded from the data.police.uk (I may add a feature like "download as CSV in future). The crime map is a density plot of the crime data. Finally, the trends tab shows bar charts of crime records over time in different crime categories. Right click on the map and you can save the image in its original size (1280 x 1280).


Customise the Maps

Continue to scroll down the menu on the left, you will find more settings for the map. Change the facet settings to create map facets according to crime type, categories and month. You can select different Google map format (roadmap, satellite, hybrid or terrain). There are also options to download the Google map image in high resolution (it takes a bit longer), in black & white and at various zoom levels. When you click the "Update" button to refresh the maps, it may take a while to show the new graphs if you have lots of facets.


Fine-tuning the Density Plots

The Density Plot Settings allow user to modify the "behind the scenes" ggplot2 codes. You can modify the layer transparency (alpha range), the number of bins, the width and the colour of the boundary lines as well as the colours of the gradient. My hope is to develop a user-friendly interface that allows users to quickly create maps with their own favourite themes. Surely, ggplot2 is much more powerful than that and has a lot more settings available. What other settings would you like to see here? Please let me know.


Exploring the Trends

Why am I including the trends visualisation? It just happened that I read this article around the same time I received the ShinyApps invitation. As I had already coded something for crime data visualisation, I thought it would be interesting to look at the data myself. So here is a handy tool for you to explore and to visualise the data with a few clicks. I will leave you with your own conclusions.


Feedback Please

As I mentioned above, I am new to web app development and this is my first ever experiment. Please have a go, create a few maps and let me know what can be done better. Thanks in advance!! All the codes are available here.