My LondonR Talk
Thanks to Mango Solutions (LondonR organiser), I was given the opportunity last night to talk about my mini project ‘CrimeMap’. Instead of going through all the technical details behind the scenes
, I chose to talk the audience through my R journey from a noob to a heavy user. CrimeMap was used as a case study to show how ones can benefit from learning R (or, in some ways, trying to justify the time I spent staring at RStudio IDE last year). The feedback was really great and the talk effectively expanded my network in the data science community so I am really grateful for that!
You can find my presentation here.
Before the main event, there was an excellent R-Python workshop by Chris Musselle. The other two interesting presentations were "Dynamic Report Generation" by Kate Hanley and "Customer Clustering for Retail Marketing" by Jon Sedar. Their presentations will soon be made available
here.
CrimeMap - A Wonderful Learning Experience
When I first started learning R for real, the goal was very simple - "let's plot something pretty with ggplot2". Well, a lot has changed since then. The more I learned, the more I discovered. I
t is really hard to summarise the 'R' awesomeness in a few slides due to its diversity. One thing I am absolutely certain is that I made the right move about a year ago to shift from MATLAB to R. Yet, I am keeping my twitter account name @matlabulous just to remind myself that ones should always keep an open mind for new and evolving technology (... and should avoid getting a tattoo of your potential ex-gf/bf's name. On that note, no, I don't have a tattoo.) For more information about the CrimeMap, please see my previous posts here, here and here.
Using Slidify for Professional Presentation
The talk was also the first time I presented something totally unrelated to water engineering. I thought, for a change, let’s try something different. Then I remembered looking at the Slidify slides from Jeff Leek’s Data Analysis course back in Jan-March last year. I thought that would fit perfectly for LondonR because the whole presentation would be coded completely in R. It would be a good reason to learn Slidify too. So I went through the Slidify examples, put some slides together, tweaked the CSS a little bit and then published it to GitHub – a streamline Slidify workflow well thought and designed by Ramnath Vaidyanathan. To me, the results are amazing! So amazing that I am confident to leave PowerPoint and use Slidify for professional presentations in the future.
rMaps + CrimeMap = rCrimemap
Two weeks before the presentation, I wrote an email to Ramnath as I wanted to thank him for Slidify. I told him how I enjoyed using Slidify for the LondonR slides. Out of the blue, Ramnath told me that he had seen my CrimeMap already and he kindly pointed me to this blog post about using Leaflet heat map in rMaps. I thought, OMG, why now? Then I thought, yeah, why not? So I created a new package called ‘rCrimemap’ based on Ramnath’s example and the codes from the CrimeMap project – just in time for the LondonR meeting. At first, I wanted to called the package something different but eventually I chose rCrimemap so it aligns well with Ramnath’s rCharts and rMaps.
Using ‘rCrimemap’
rCrimemap is still raw and experimental. It depends on some new packages such as dplyr, dev version of rCharts and rMaps etc. I have only developed and tested it recently on Linux. Please give it a try if you have a chance. All feedback and suggestions are welcome. Codes are here.
To install it, you will need the RStudio IDE version 0.98.501 or newer and the following packages ...
require(devtools)
install.packages(c("base64enc", "ggmap", "rjson", "dplyr"))
install_github('ramnathv/rCharts@dev')
install_github('ramnathv/rMaps')
After that, install rCrimemap package via ...
install_github('woobe/rCrimemap')
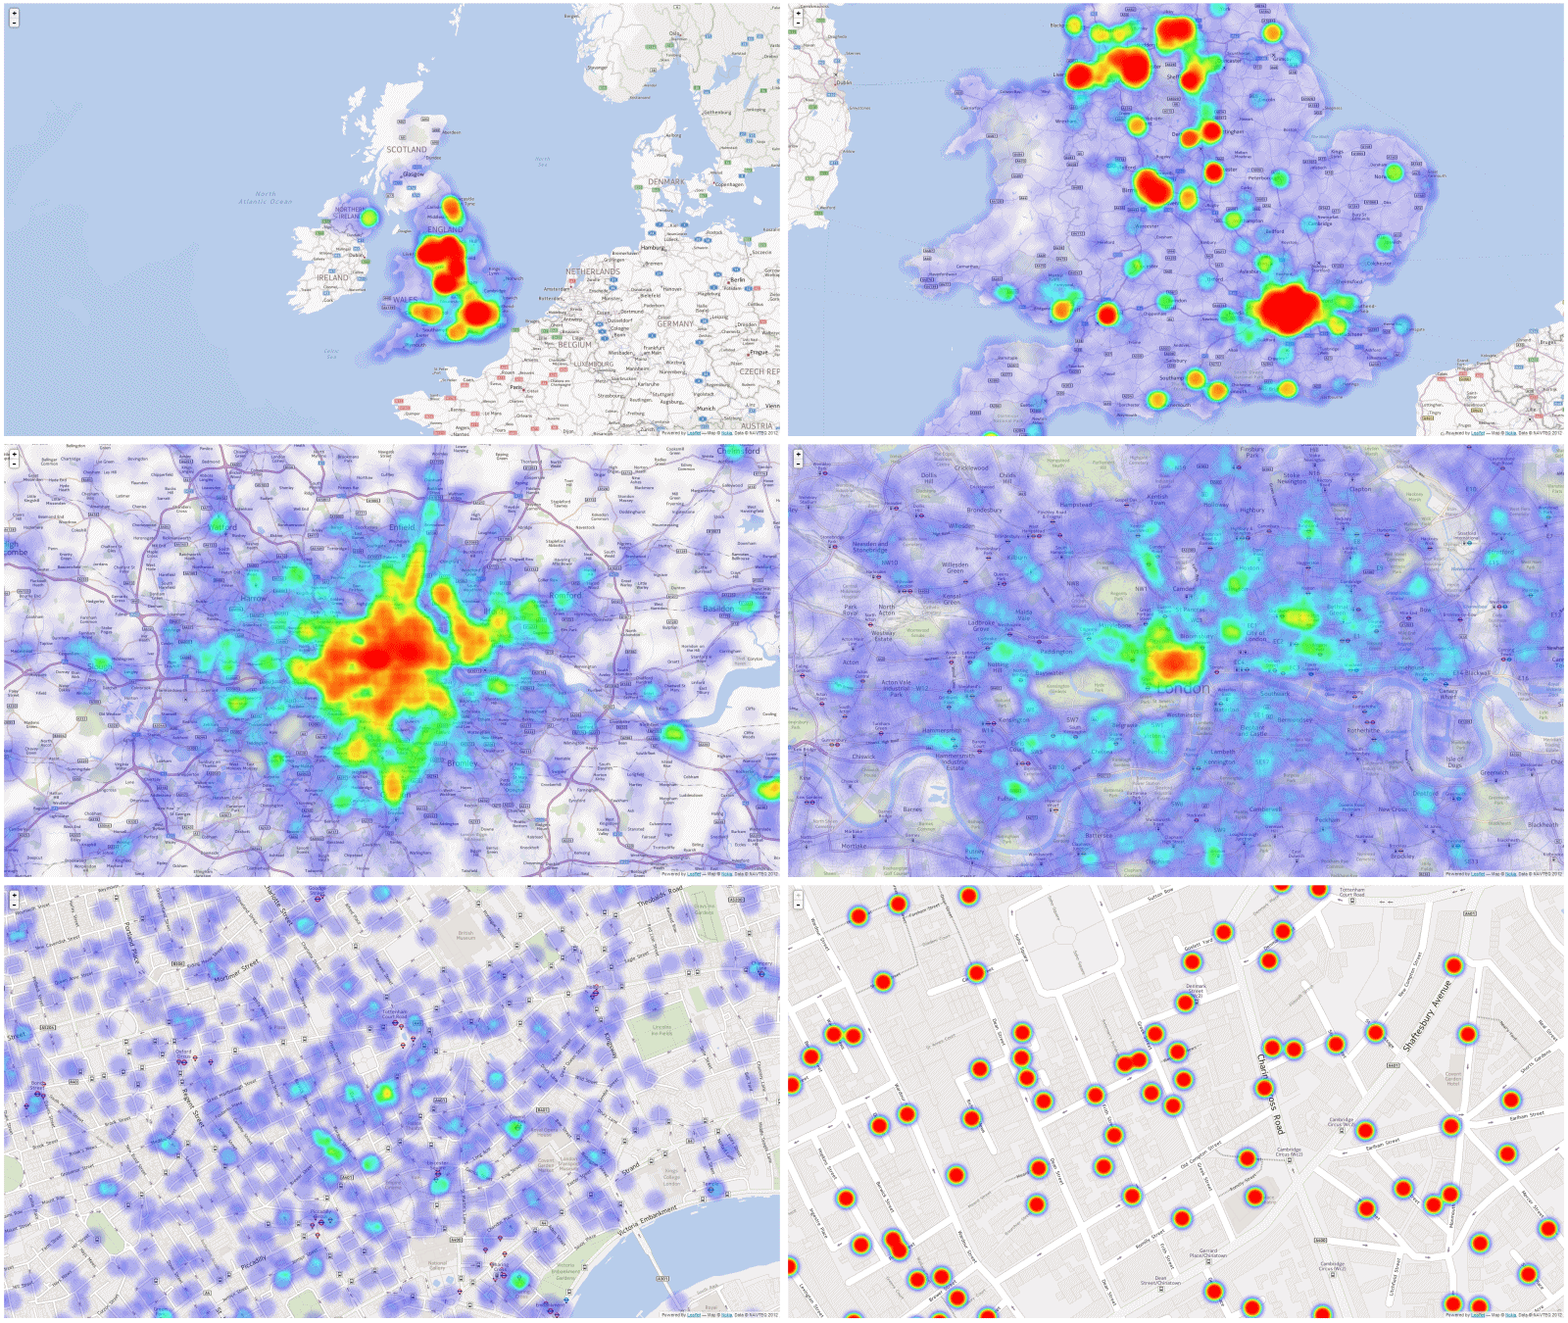
rCrimemap is basically a big wrapper function. In fact, there is only one function 'rcmap( )' in the package at the moment. (OK, it is obviously an overkill ... but I really wanted to try developing a package.) The function is very similar to the first one I did for CrimeMap prior to the Shiny development. In terms of graphical functionality, it is not as flexible as the CrimeMap yet (for example, CrimeMap can do all these colours and facet). However, it is much more powerful than CrimeMap in the sense that users can move around, zoom in and out like using a real digital map. The colour of the heat map also changes when you zoom in/out. This gives users a much better visibility of where the local crime hot spots are when they zoom in. OK, enough said, let’s go through some example usage …
The arguments of the function 'rcmap( )' are:
- location: point of interest within England, Wales and Northern Ireland
- period: a month between Dec 2010 and Jan 2014 (in the format of yyyy-mm)
- type: category of crime (e.g. "All", "Anti-social behaviour")
- map_size: the resolution of the map in pixel (e.g. Full HD = c(1920, 1080))
- provider: the base map provider (e.g. "Nokia.normalDay", "MapQuestOpen.OSM")
- zoom: zoom level of the map (e.g. I recommend starting with 10 to show all the crimes)
Example 1: “Ball Brothers EC3R 7PP
” (LondonR venue since March 2013) during the London riot (Aug 2011). The map can be viewed within RStudio IDE or be exported to a browser. The animation was created outside R (Oh ... what if rCrimemap + animation package? ... I will leave that for later.)
rcmap("Ball Brothers EC3R 7PP", "2011-08", "All", c(1000,1000),"Nokia.normalDay")
Example 2: Manchester in Jan 2014 - using "MapQuestOpen.OSM" as base map instead.
rcmap("Manchester", "2014-01", "All", c(1000,1000), "MapQuestOpen.OSM")
Credits
There you go, enjoy :)


