
Thing To Try After useR! part 2 (TTTAR2)
Originally, this post was supposed to be a sequel to TTTAR1 about h2o machine learning. Since TTTAR1 I have been carrying out more h2o tests both locally and on the cloud with the very kind support of Nick Elprin from Domino. The more I find out about h2o and Domino, the more I get addicted. So my original plan was to write a new post about combining the best of h2o and Domino - building a scalable data analytic platform on the cloud with R as the main interface.
Well something happened unexpectedly so here is a change of plan – I am going to talk about Shiny web application and data visualisation again. I will get back to h2o machine learning and Domino later. In the meantime, check out Nick’s recent blog post about Domino which is directly relevant to what I am planning to blog next.
Beautiful Shiny Apps at useR!
I know how to use Shiny and Bootstrap. Yet, before useR!, I had never felt the need to combine them. Shiny already has a clean and tidy layout by default – so why bother changing it? But then I changed my mind completely after useR!. There were quite a few beautiful Shiny apps with custom CSS on display. For example, during the second poster session, I saw this amazing Shiny app created by Christian Gonzalez and Robert Youmans.


When I had the chance to play with the app on Christian’s laptop, that sleek and professional interface just completely blew my mind. It was at this moment I realised that I was wrong and it’s time to up my game.
Revolution Analytics Data Visualisation Contest
Just like how I learned about maps in R last year, I needed to find something interesting and dive into it. After useR!, I read about this contest from Joseph’s post. It seemed like a good data visualisation exercise with a small and tabulated dataset. It was also a good opportunity to combine Shiny and rMaps (something that I hadn’t managed to do when I last worked on rCrimemap many months ago).
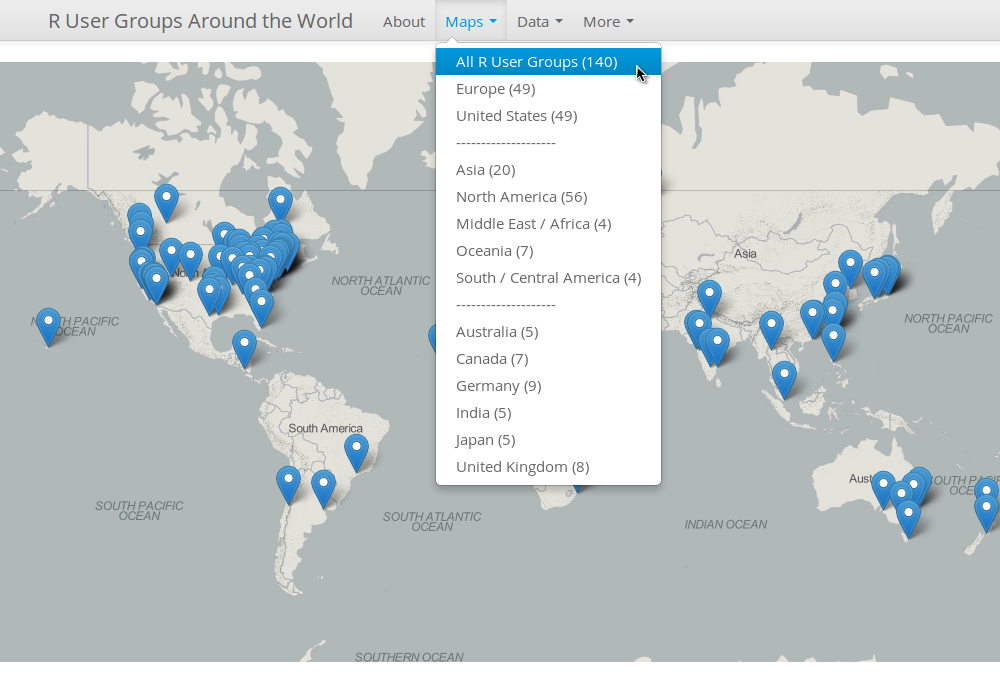
The Making of R User Groups Maps (RUGSMAPS)
Many thanks to the detailed Shiny examples from RStudio and Chris Beeley’s book as well as the huge rCharts/rMaps contributions by Ramnath Vaidyanathan and Kenton Russell on GitHub and Stackoverflow, I didn't need to spend much time on coding as many useful code snippets are just one Google search away.
I did, however, spend a lot more time on the layout design and user interface. Font size, colours, white spaces, choice of base map etc you name it. I also tried quite a few Bootstrap themes and finally settled with Spacelab. I am not the best person to describe the final design with correct art terminology. I just feel that this combination of blue, grey and white gives a clean layout (yet not too flashy). The RUGSMAPS app is currently hosted on ShinyApps (once again, thanks RStudio!!!)
What's Next?
As the RUGSMAPS app is my final submission to the contest, I am going to lock down the version so the app becomes a reference point version 1. Further improvements will be made independently (let’s just call it RUGSMAPS v2 for now). The idea is to collect more local information from the RUGs and display it accordingly on the maps. For example, in additional to the group name and city location, I can include more information such as usual meetup location, key sponsors, website, photos etc.
I have seen a cool example from Alex Bresler that shows images in the markers’ pop-up window. I am certain that we can display more information than just the group name and city location. BTW, Alex and his colleagues at Aragorn Technologies are doing some very cool interactive sports data visualisation with R for huge events (e.g. NBA, US Open) – do check them out!!!
Together We Can Make It Better!
If you have some local information about the RUGs and are interested in improving the RUGSMAPS for the community, please drop me an email (jofai.chow@gmail.com), comment on this post or create issues on the repository. We can make this a central info hub of all RUGs! Let’s do it!!!
Acknowledgement
First of all, I would like to thank Revolution Analytics (David and Joseph) for the award! I would also like to emphasise that the RUGSMAPS app did not just come out of my head from nowhere. It is the direct result of many cool ideas I learned and borrowed from the R community over the last year or so. To all my R friends I met on Twitter / GitHub / useR!, if you're reading this, you know I am talking about you. So thank you very much everyone!
The Rise of R in Hydroinformatics

(View from the Empire State Building Observatory - it was at this moment I realised that I should begin my career as Batman)
Just a bit off the topic, I attended the Hydroinformatics conference in New York last week and I witnessed the rise of R in this field. Although MATLAB still seems the most common programming language (ever wonder why my twitter handle sounds a bit too odd?), there were more talks about using R for Hydroinformatics this time (compared to none in the same conference two years ago). People were presenting their R packages and discussing how they use R for interfacing as well as teaching. RStudio IDE was on the big screen several times!
Yet, still no sight of Shiny but I think I can change that!!!